Modern Monitoring Sucks.
Posted: 2024-11-24
Why has modern monitoring/"observability" become more and more complicated?
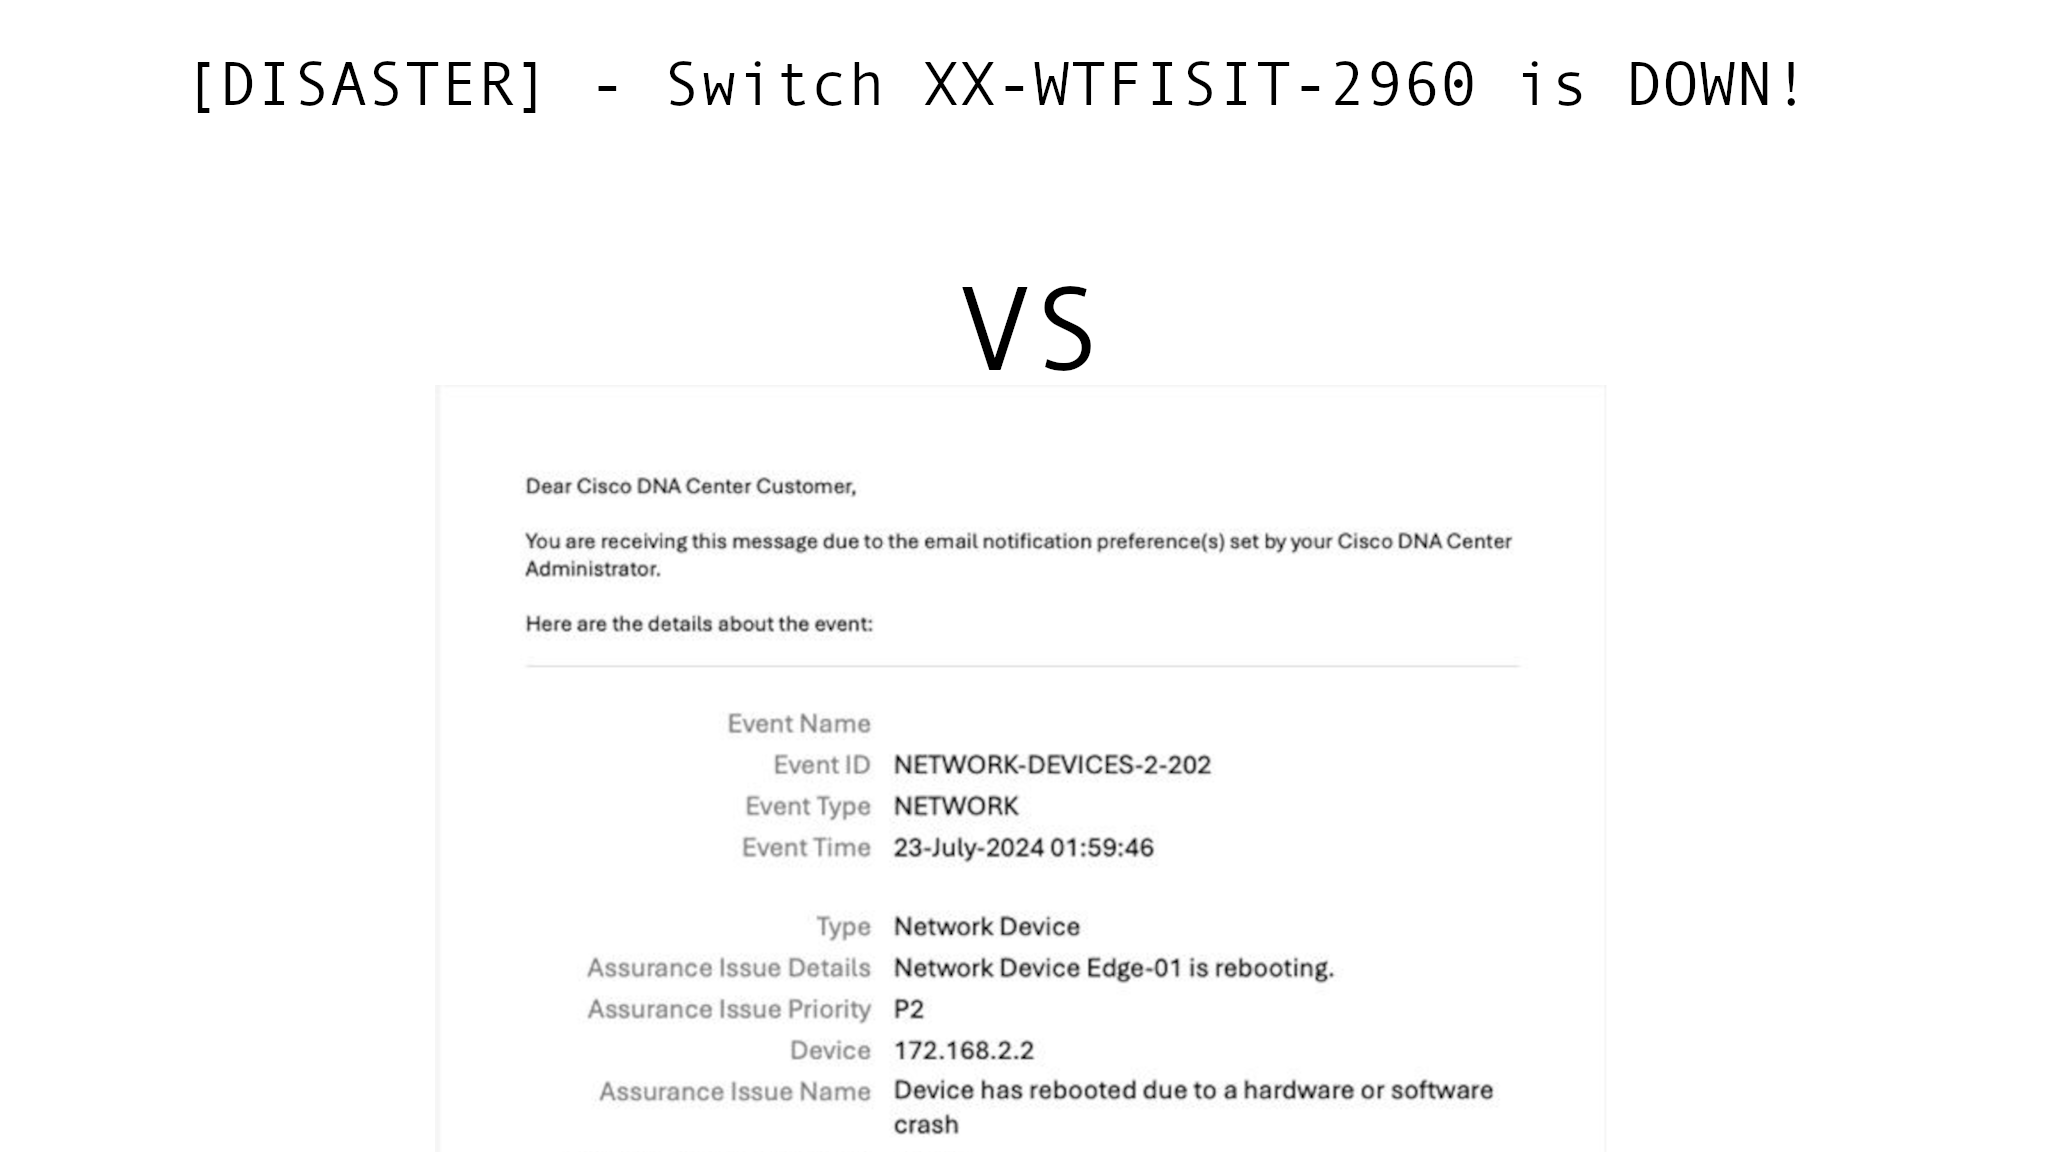
I cannot tell if it is just me or not but I've recently set up Cisco DNA..*cough*, I mean Catalyst Center, and have been massively disappointed. There is not an option to set up any sort of "custom" notification directly inside of CC, and if what you are trying to monitor is not in the pre-defined list of notifications then you are absolutely going to need another platform to monitor your set up.
I started looking around at different products and solutions but have been disappointed in every step of the way.
Monitoring vs Observability
 Companies, please do a better job of defining your "Monitoring" vs your "Observability" products. This is due to the Gartner buzz-word of "Observability" and "single pane of glass" nonsense that has been spewing out for YEARS. They are not the same, and stop pretending as much.
Monitoring, is reactive. Something happens. I want an alert if a switch goes down for example.
Observability, is a tool you use to scale and view historical data.
Actual monitoring products I briefly looked at and my thoughts.
Grafana / Prometheus Stack - Once again we need to look specifically at Monitoring so I will be removing Grafana from this thought. I've tried implementing Prometheus as it is free, and after a dew days I have decided to dump it. It does very well on doing exactly what you tell it to do. Rather unfortunately I have a small team and the amount of set up required for Prometheus would border months for our infrastructure.
PRTG - Paessler, PRTG was great 10 years ago. We actually already had PRTG in place but our solutions engineer only recommended scanning sensors very 5 to 10 minutes. Are you kidding me? So, if an access switch goes down.. you want me to wait 10 minutes for me to know about it? That's not monitoring, that's more basic observability compared to monitoring. Really? The dashboard making process is also hot garbage using pre-canned stuff. I don't know what these guys have been creating the past 10 years except for bug fixes and charging more money.
Cisco Catalyst Center (Or, DNA) - If you are running an all Cisco Catalyst shop, it is great-ish. Like I mentioned before there is no support for custom notifications via email, and also I don't need a rich text email for everything. Less fancy, more data of what is actually going on. Also when I checked it only supports limited amount of Nexus devices and Cisco FWs... which Cisco just wants to sell you Nexus Dashboard so I guess I get it?
Zabbix - This is probably the most traditional monitoring platform. You can plug in, and it will automatically find sensors/OIDs to monitor. You get email. Email can be plain text. That makes me happy. I need to play with it more, but it is promising.
Splunk Infrastructure Monitoring - I think this uses some mix of Telegraf and an SNMPwalk thing. I have a meeting with these guys coming soon but a partial look shows it will not do what I'm looking for at all.
Woodstone ServersAlive - This is on my list to try out because for just pinging stuff? It's great! PLAIN TEXT notifications, thank god.
Nagios - It's meh, like all the other platforms it just takes time to fully fledge out.
SolarWinds - We currently have this. Quite frankly I don't trust the company. It does an alright job but the dashboard making process is quite laborious.
Conclusion
Same with everything else in the IT industry at the moment, it has been infected with buzz words and profit hunting which is really unfortunate. It is just sad because I feel like there's a big opportunity for just basic monitoring.

 Companies, please do a better job of defining your "Monitoring" vs your "Observability" products. This is due to the Gartner buzz-word of "Observability" and "single pane of glass" nonsense that has been spewing out for YEARS. They are not the same, and stop pretending as much.
Monitoring, is reactive. Something happens. I want an alert if a switch goes down for example.
Observability, is a tool you use to scale and view historical data.